Global
EV Charging Statistics: How to Compare Countries Fairly
Read IEA public EV charging statistics using the same year, charger definition, vehicle denominator and installed capacity.
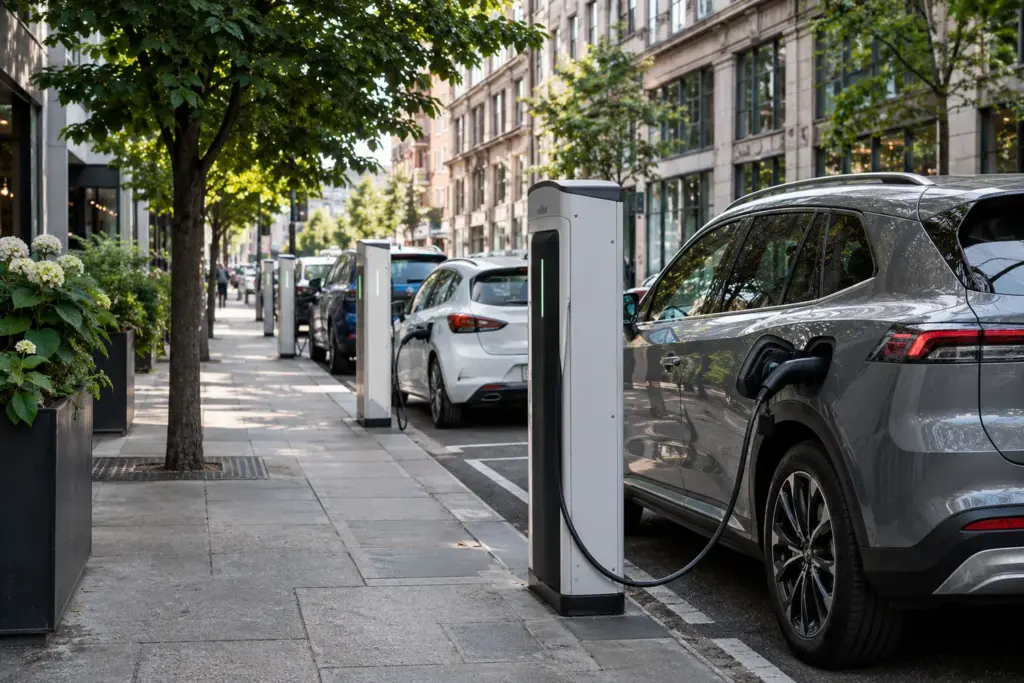
The IEA estimates that there were more than 7 million public charging points worldwide at the end of 2025. Its Global EV Outlook 2026 also puts the global ratio at around 11 electric light-duty vehicles per public point and power capacity at about 4.5 kW per electric light-duty vehicle. These figures answer three different questions.
- Public charging points
- More than 7 million
- Electric light-duty vehicles per public point
- Around 11
- Public installed power per electric light-duty vehicle
- About 4.5 kW
Source: IEA Global EV Outlook 2026. The measures use different units.
Use more than the total charger count
The total counts public charging points, which may share a single location. The vehicles-per-point ratio adds a fleet denominator, allowing a more meaningful comparison across markets of different sizes. Installed public kW per vehicle adds a measure of potential power. None tells you how likely one charger is to work when you arrive.
For an illustrative comparison, two markets could each have 20,000 public points. If one has 200,000 electric light-duty vehicles and the other has 400,000, their ratios are 10 and 20 vehicles per point. If the second market has much more power per point, a driver could still see a shorter stop in some places. You would need local information to test that conclusion.
Record the date, definition and map
Keep private home or workplace sockets separate from public points. Use the same vehicle classes and the same reporting period. Then look at the map for gaps between cities and compare connector support and usable access hours. National growth tells you how the network is expanding. A corridor check is what helps a driver decide where to stop.
Further reading
VORAVUE Verify
Evidence: A · Primary-source confirmed
The global figures are end-of-2025 IEA estimates reported in the Global EV Outlook 2026. They describe capacity and inventory, not availability on an individual route.